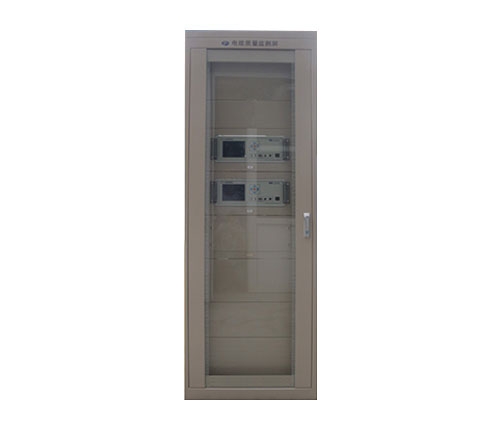
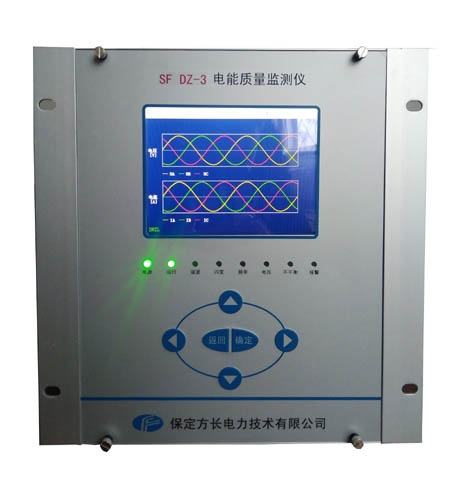
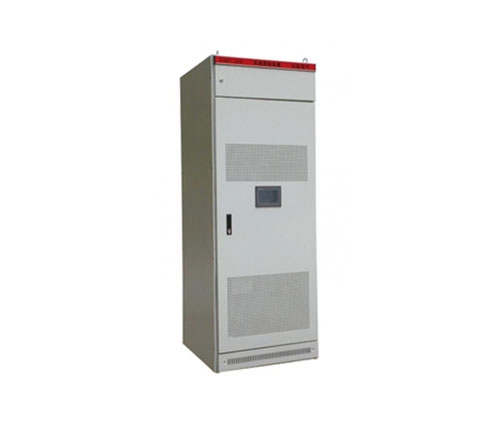
Using benchmark algorithms, there is no approximate calculation for harmonics, three-phase imbalance, flicker, and fluctuations. High precision A/D (16 bit) is used, and sampling is conducted simultaneously. The acquisition rate is 12.8 kHz, which meets the requirements of national standard A-level instruments.Power quality monitoringdeviceBuilt in 512M memory, data is stored in units of 5 minutes, and each channel can continuously store 4 months of historical data.
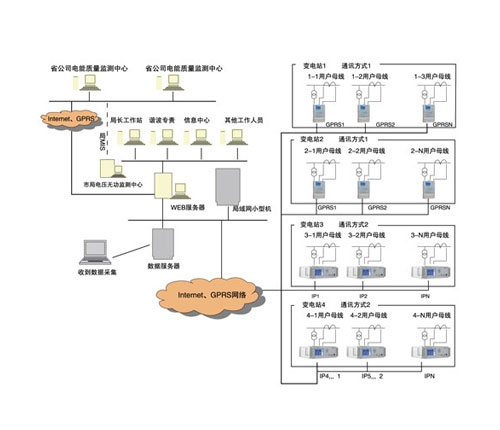
Supports multiple communication methods such as TCP/IP, RS232, 485, and supports ministerial 103 and MODBUS protocols, enabling data upload functionality. Single or multiple GDDN-500C devices can form a screen, and the screen can be configured with an industrial computer, LED display, and background analysis software to form a on-site workstation. All data can also be remotely transmitted to the monitoring center.Multiple GDDN-500C devices can form a remote harmonic monitoring network, transmitting all data communication to various workstations or monitoring centers, and achieving remote multi-level monitoring and hierarchical management through backend analysis software.
The backend monitoring and analysis system supports: remote setting of site parameters; Can switch to any line of any monitored substation to display real-time data, waveform, and spectrum; Output various functional curves and can scale, translate, and compare the curves; Generate pie and column distribution maps of power quality; Automatically output power quality statistical reports, statistical values, 95% probability values, and average values. This device can be equipped with a printer function according to customer needs, and other data and functions can also be added to the backend analysis software.
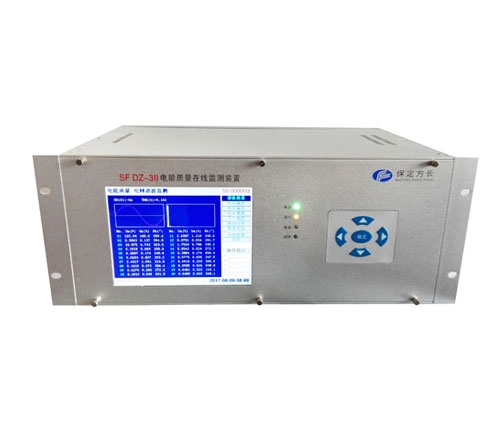
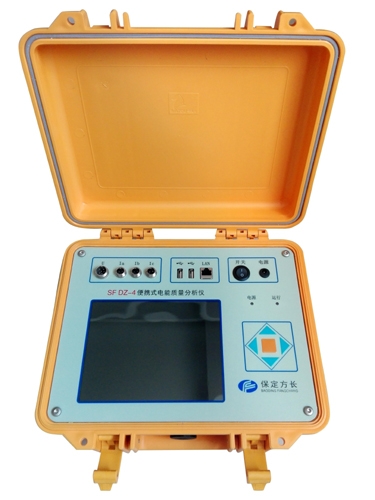
Measure and analyze the quality of AC power supplied by the public power grid to the user's receiving end. The measurement and analysis indicators include power supply frequency deviation, power supply voltage deviation, power supply voltage fluctuation and flicker, allowable imbalance of three-phase power supply voltage, and harmonic of the power grid. Wavelet transform is used to measure and analyze the harmonic of non-stationary time-varying signals. Measure and analyze the impact of various electrical equipment on the power quality of the public power grid under different operating conditions.
Load fluctuation monitoring: Regularly record and store the trend of changes in power parameters such as voltage, current, active power, reactive power, frequency, phase, etc. Dynamic monitoring of power equipment adjustment and operation process helps users solve problems that arise during the adjustment and operation of power equipment. Test and analyze the causes of faults such as circuit breaker action, transformer overheating, motor burning, and automatic device malfunction in the power system. Test and analyze the dynamic parameters of reactive power compensation and filtering devices in the power system, and quantitatively evaluate their functions and technical indicators.
![]() National ordering hotline:fifteen billion eight hundred and three million one hundred and twenty-five thousand five hundred and sixty-five
National ordering hotline:fifteen billion eight hundred and three million one hundred and twenty-five thousand five hundred and sixty-five


