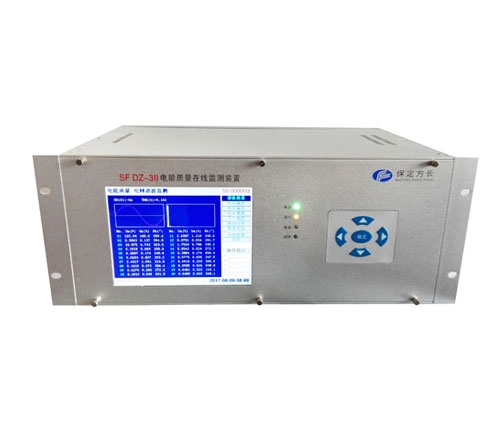
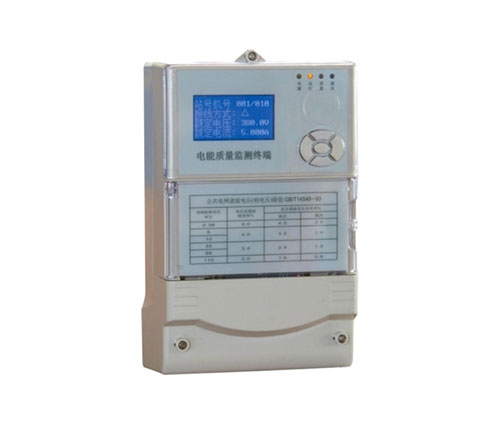
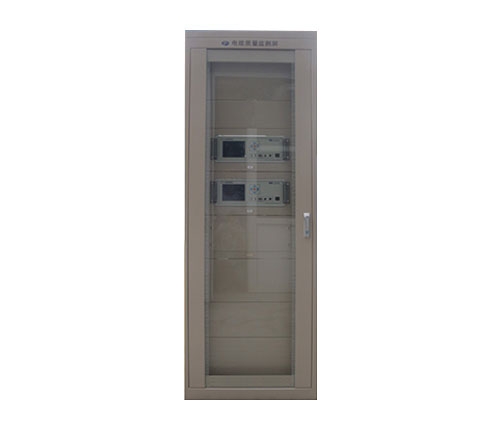
Power quality monitoring仪Equipped with CAD single line diagram to display the wiring situation of medium and low voltage distribution networks. The massive system has the function of multi screen switching and screen navigation, while the dispersed power distribution system has the main screen of the system in a spatial and geographical plane. The main screen can directly display the operating status of each circuit, and has the function of coloring the circuit with power, non power, and faults. The main electrical parameters are directly displayed on the human-computer interaction interface and refreshed in real-time.
Different levels of users can be granted different permissions to ensure the reliability of the system during operation. For the closing/opening operation of an important circuit, an operator level user needs to input the operation password, and an engineer level user needs to input a confirmation password before the operation can be completed.Through the Acrel-2000 power monitoring system, various electrical parameters and switch status of on-site equipment can be collected in real time and at a fixed time. The collected data can be directly displayed or new intuitive data information can be generated through statistical calculation and displayed, and important information can be stored in a database.
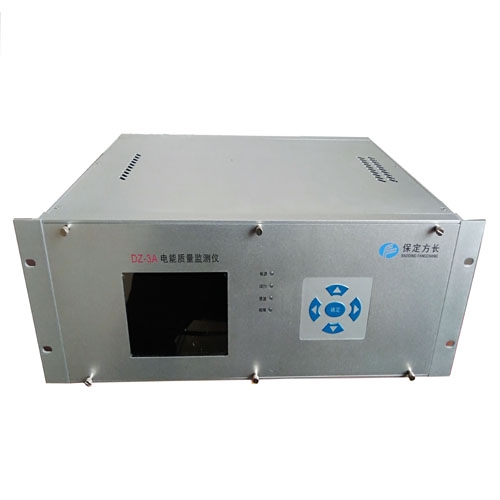
The system provides two curve analysis interfaces: real-time curve and historical trend. By calling the real-time curve interface of the relevant circuit, the current load operation status of the circuit can be analyzed. By calling the real-time curve of a certain distribution circuit, the signal fluctuation caused by the electrical equipment of the circuit can be analyzed. The historical trend of the system refers to the system, and all stored data can be viewed to facilitate quality analysis of the monitored distribution network by engineering personnel.
The system has a standard electricity report format and can design report formats that meet user needs according to their needs. The system can automatically design. It can automatically generate various types of real-time operation reports, historical reports, event fault and alarm record reports, operation record reports, etc. It can query and print all data values recorded by the system, and automatically generate daily, monthly, quarterly, and annual electricity reports.
The power system power quality monitoring instrument generates electricity rate reports based on the time period of the compound rate and the set value of the rate. The starting point, interval, and other parameters for querying and printing can be set by oneself. The system design can also customize report output functions to meet different requirements according to user needs.
![]() National ordering hotline:fifteen billion eight hundred and three million one hundred and twenty-five thousand five hundred and sixty-five
National ordering hotline:fifteen billion eight hundred and three million one hundred and twenty-five thousand five hundred and sixty-five


