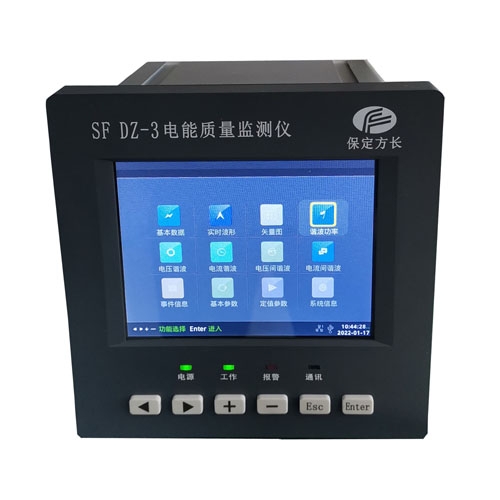
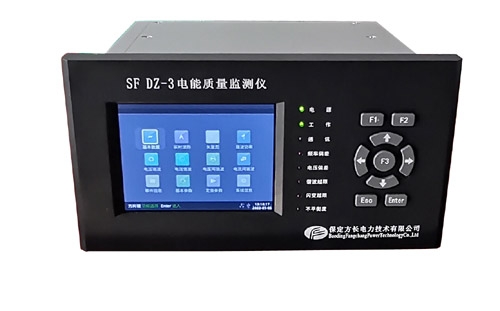
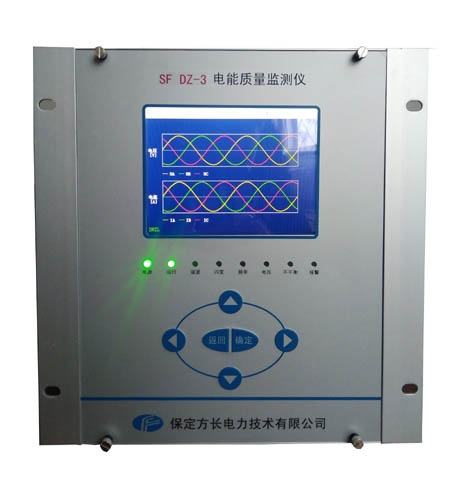
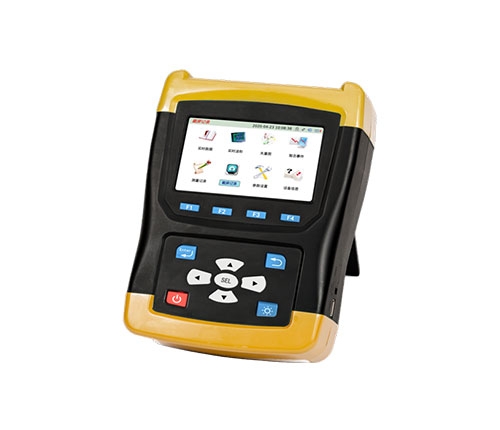
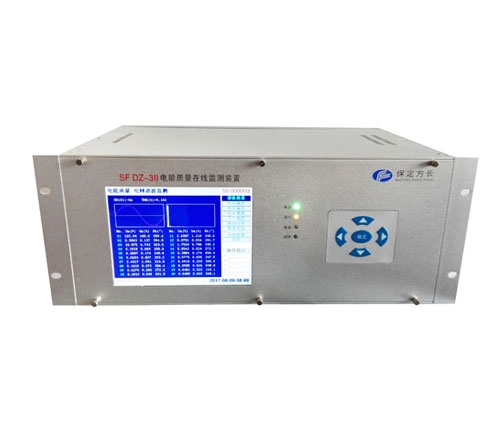
Technical indicators of power quality monitoring devices
Release date:January 14, 2020 Author:Fangchang Electric Power Click:
Power quality monitoringdeviceTechnical indicators:
1Frequency measurement:Measurement range:forty-five~55HzCenter frequency50HzMeasurement condition: The fundamental component of the signal is not less than80%F.S;measurement error: ≤0.02Hz;Input voltage range:AC10~120V;Input current range:5A;Fundamental voltage and current amplitude: allowable error of fundamental voltage ≤0.5%F.S.; Allowable error of fundamental current ≤1%F.S;Measurement error of phase difference between fundamental voltage and current: ≤zero point five°;Measurement error of harmonic voltage content: ≤0.1%;Measurement error of harmonic current content: ≤0.2%;Three-phase voltage imbalance error: ≤0.2%;Voltage deviation error: ≤0.2%;Voltage variation error: ≤0.2%;Power deviation: ≤5%;Flicker error: ≤5%.
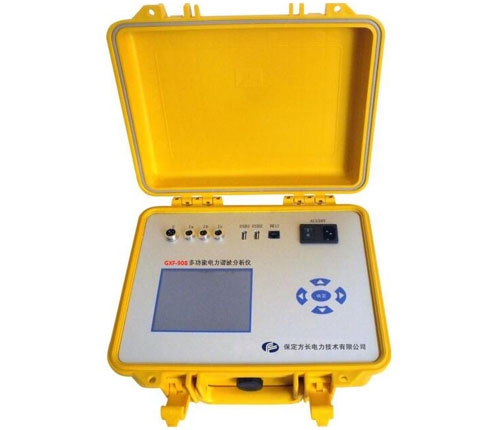
2. Using benchmark algorithms for approximate calculations of harmonics, three-phase imbalance, flicker, and fluctuations, with high accuracyA/D(sixteen Bit), simultaneous sampling, collection rate12.8 kHz, in accordance with national standardsA Level instrument requirements.OnlinePower quality monitoring devicebuilt-in512MMemory to5Store data in minutes, with each channel capable of continuous storage4Historical data for months.supportTCP/IP、RS232、four hundred and eighty-fiveVarious communication methods, including support for ministerial awardsone hundred and three、MODBUSProtocol,Can achieve data upload function。Single or multiple unitsGDDN-500CThe device can be grouped into screens, and an industrial computer can be configured on the screen bodyLEDThe display and backend analysis software form an on-site workstation, which can also remotely transmit all data to the monitoring center.
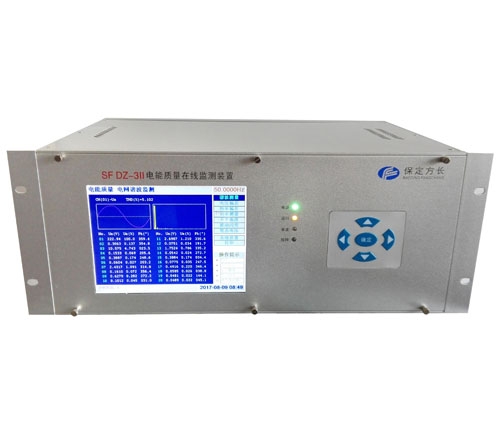
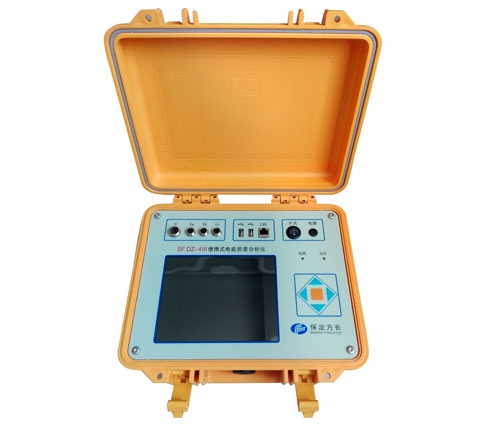
3. Multiple unitsGDDN-500CThe device can form a remote harmonic monitoring network, transmit all data communication to various workstations or monitoring centers, and achieve remote multi-level monitoring and hierarchical management through backend analysis software.The backend monitoring and analysis system supports: remote setting of site parameters; Can switch to any line of any monitored substation to display real-time data, waveform, and spectrum; Output various functional curves and can scale, translate, and compare the curves;Generate pie and column distribution maps of power quality; Automatically output power quality statistical reports95%Probability value, average value.Power quality monitoring deviceAccording to customer needs, printer functions can be added, and other data and functions can also be added to the backend analysis software.
This article's website:/news/470.html
Keywords:Power quality monitoring device,Online monitoring device for power quality,Power quality
Recent Views:
Related products:
Related news:
- How to ensure the real-time performance of online power quality monitoring devices?
- What power quality analyzers are available in the market?
- Power Quality Monitor: A Good Assistant for Power System Fault Diagnosis?
- The Development Trend of Power Quality Monitoring Devices
- What is the significance of sensor technology for power quality monitoring devices?
- What are the roles and advantages of power quality monitoring in energy management?
- How to solve the problem of power waste through power system power quality monitoring instruments?
- What are the analytical instruments for accurately measuring power quality?
- What are the technological innovations in power quality monitoring equipment?
- What are the common functional features of power quality monitoring screens?


