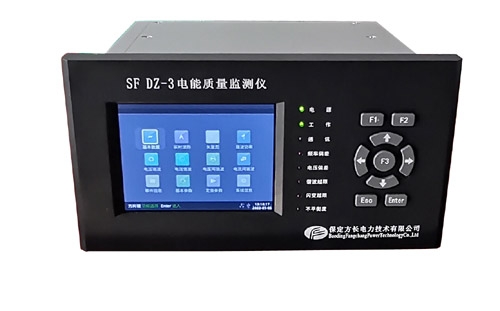
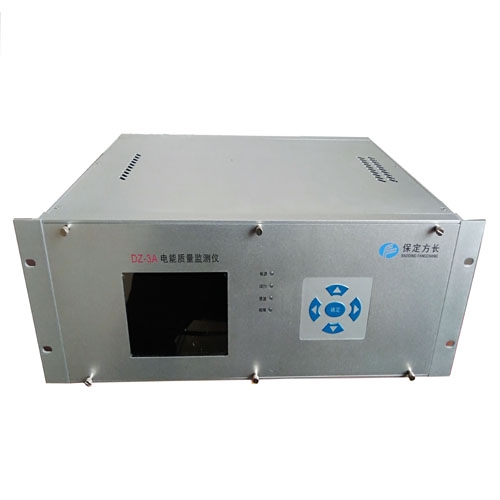
AC Power Quality MonitorWhat are the functions of the
1. Applying wavelet transform to measure and analyze the harmonics of non-stationary time-varying signals.
2. Measure and analyze the AC power quality supplied by the public power grid to the user end.
3. Measure and analyze the impact of various electrical equipment on the power quality of the public power grid under different operating conditions.
4. Dynamic monitoring of power equipment adjustment and operation process helps users solve problems that arise during the adjustment and operation of power equipment.
5. Test and analyze the dynamic parameters of reactive power compensation and filtering devices in the power system, and quantitatively evaluate their functions and technical indicators.
6. The real-time monitoring function receives and displays on-site test data, waveforms, and spectra in real time, and has data printing and bitmap storage functions;
7. Automatically store instantaneous analysis values. The remote parameter setting function can remotely read and modify various parameter settings of the lower computer, such as voltage to current ratio, rated voltage, wiring method, communication rate, and other measurement parameter settings. The data reception and processing function automatically or manually receives historical data stored within the instrument at any time period to the backend monitoring management machine;
8. Store the sent data and further analyze and process it based on the selected time period or test data filtering conditions; Form a comprehensive statistical report based on statistical and analytical conditions for the data sent on site. The graphic output function outputs the trend curves of various parameters, which can be compared, scaled, and translated. The images can also be exported to BMP format, including long-term trend curves of fundamental voltage and fundamental current; Long term trend curve of total distortion rate of voltage and current; Long term trend curve of voltage and current harmonics; Grid frequency trend curve; Trend curves of long-term flicker value (Plt) and short-term flicker value (Pst); Voltage three-phase imbalance and trend curves of voltage and current sequence components; Power and power factor trend curves, etc