AC Power Quality MonitorSystem composition:
System composition:Power system power quality monitoring instrumentMainly composed of on-site monitoring layer, communication transmission layer, and data management layer. There are three modes of networking: cable, fiber optic, and wireless.
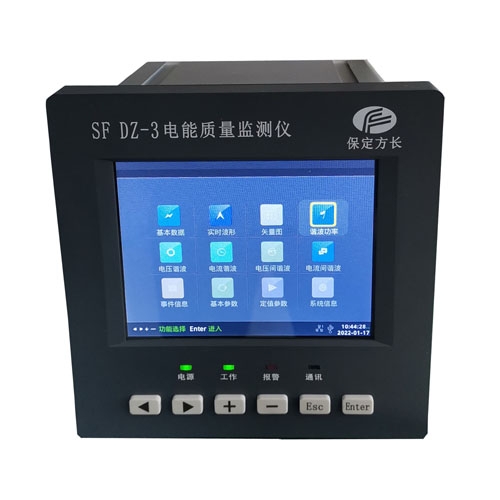
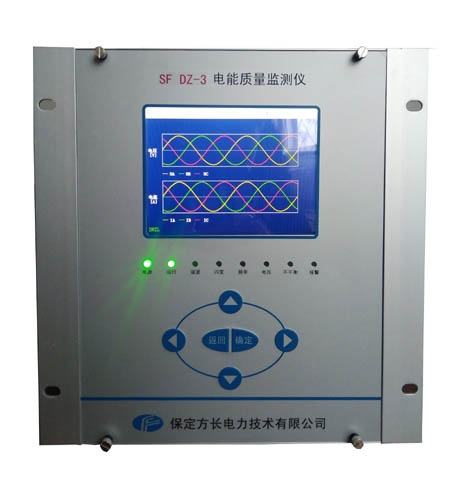
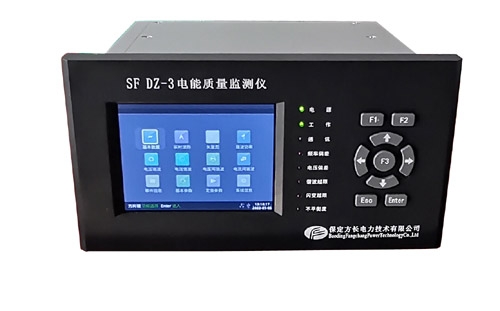
1On site monitoring layer:Install various types of electrical energy and power quality monitoring equipment on site, and require communication functions.
2Communication transmission layer:In order to transmit the data collected by monitoring layer devices to the server, the devices responsible for data communication transmission mainly include communication management machines, serial servers, network switches, etc. The data collection terminal communicates with the monitoring layer device through a serial port, reads the data, conducts preliminary analysis and organization, and saves the data locallySDIn the card, the data is then transmitted to the wireless communication module. The wireless communication module adopts radio frequency technology to form a wireless local area network on site, collecting data organized by various data collection terminals and transmitting it to the backend server. Data can also be transmitted through network cables or optical fibers.
3Data management layer:The process of storing, parsing, and applying collected data, including server setup and various software applications.

System functions:
1StandardPower system power quality monitoring instrumenthaveCADDisplay the wiring situation of the medium and low voltage distribution network in a single line diagram; The massive system has the function of multi screen switching and screen navigation; The decentralized distribution system has a spatial and geographical plane of the system's main screen. The main screen can directly display the operating status of each circuit, and has the function of coloring the circuit with power, non power, and faults. The main electrical parameters are directly displayed on the human-computer interaction interface and refreshed in real-time.
2user management
Different levels of users can be granted different permissions to ensure the reliability of the system during operation. For example, the closure of an important circuit/The opening operation requires an operator level user to input the operation password, and an engineer level user to input a confirmation password before completing the operation.
3Data collection and processing
Through the power monitoring system, various electrical parameters and switching status of on-site equipment can be collected in real-time and timed, including three-phase voltage, current, power, power factor, frequency, harmonics, imbalance, and currentKCoefficient, telephone waveform factor, voltage peak coefficient, electrical energy, temperature, switch position, equipment operation status, etc.), the collected data will be directly displayed or generated through statistical calculation to display new intuitive data information (total system power, load value, upper and lower limits of power factor, etc.), and important information will be stored in the database.

4Trend curve analysis
Power system power quality monitoring instrumentTwo curve analysis interfaces, real-time curve and historical trend, are provided to analyze the current load operation status of the relevant circuit by calling the real-time curve interface of the circuit. By calling the real-time curve of a certain distribution circuit, the signal fluctuation caused by the electrical equipment of the circuit can be analyzed. The historical trend of the system refers to the ability of the system to view the historical trend of all stored data, making it convenient for engineering personnel to conduct quality analysis on the monitored distribution network.
5Report Management
The system has a standard electricity report format and can design report formats that meet user needs according to their needs. The system can automatically design. It can automatically generate various types of real-time operation reports, historical reports, event fault and alarm record reports, operation record reports, etc. It can query and print all data values recorded by the system, and automatically generate daily, monthly, quarterly, and annual electricity reports. Generate a report on the electricity rate based on the time period of the compound rate and the set value of the rate. The starting point, interval, and other parameters for querying and printing can be set by oneself; The system design can also be customized according to user needs to meet different report output functions.