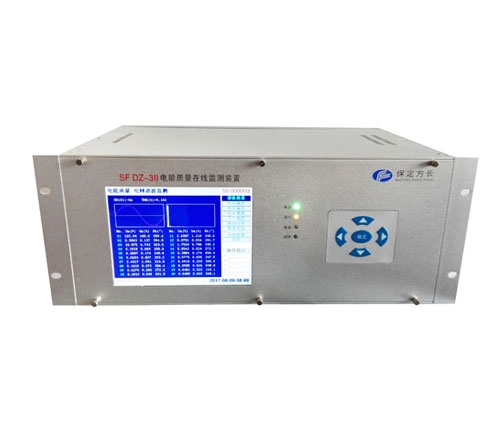
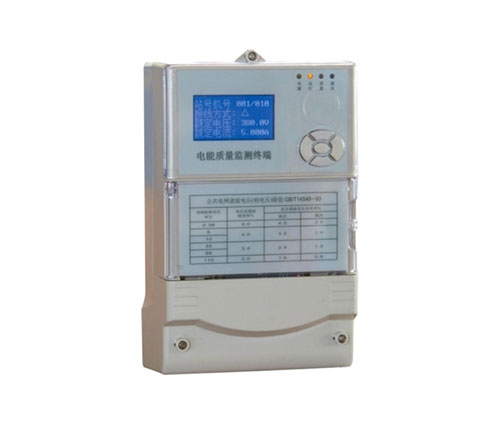
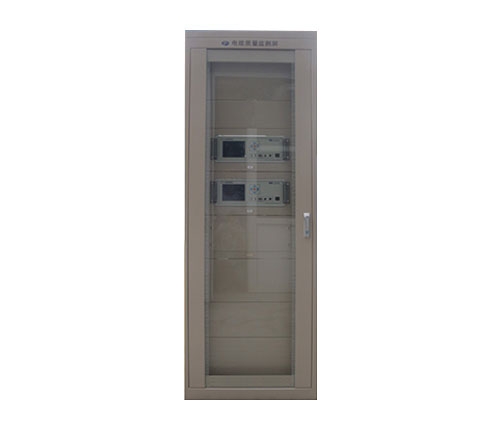
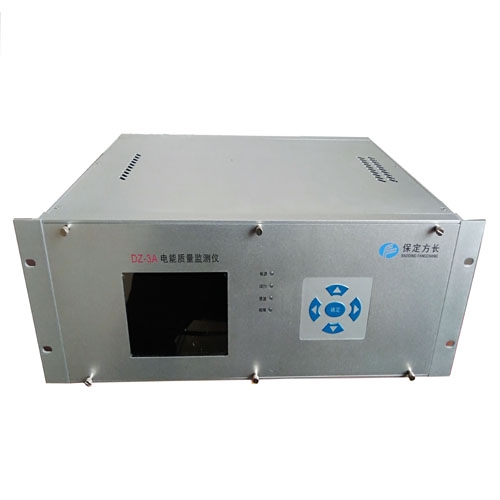
1Power quality monitoring仪Data processing is fast and accurate, with powerful functions, greatly improving testing efficiency and level, making the system more integrated and stable. It is equipped with a dedicated watchdog reset circuit, which can automatically reset in strong interference environments to ensure normal operation. Adopting a large screen LCD display screen with a full Chinese interface and menu system, the operation is simple and convenient, and can display real-time parameters such as power quality, as well as voltage and current harmonic analysis graphics and tables.
2. Multiple testing channels, flexible configuration, capable of measuring 8 channels × 3-phase voltage signal, 8-way × 3-phase current signal; Can provide multiple alarm and trip relay contacts; The voltage input adopts a high voltage isolation module, and the current input adopts a high-precision current transformer to isolate the input signal from the measurement system, greatly improving the anti-interference ability and safety of the device.
3. Using benchmark algorithms, there is no approximate calculation for harmonics, three-phase imbalance, flicker, and fluctuations. High precision A/D (16 bit) is used, and sampling is conducted simultaneously. The acquisition rate is 12.8 kHz, which meets the requirements of national standard A-level instruments. OnlinePower quality monitoring deviceBuilt in 512M memory, data is stored in units of 5 minutes, and each channel can continuously store 4 months of historical data.
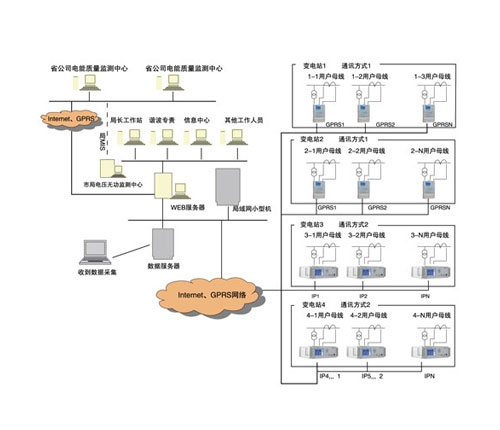
4. Supports multiple communication methods such as TCP/IP, RS232, 485, and supports ministerial 103 and MODBUS protocols, enabling data upload functionality Single or multiple GDDN-500C devices can form a screen, and the screen can be configured with an industrial computer, LED display, and background analysis software to form a on-site workstation. All data can also be remotely transmitted to the monitoring center. Multiple GDDN-500C devices can form a remote harmonic monitoring network, transmitting all data communication to various workstations or monitoring centers, and achieving remote multi-level monitoring and hierarchical management through backend analysis software.
5. The backend monitoring and analysis system supports: remote setting of site parameters; Can switch to any line of any monitored substation to display real-time data, waveform, and spectrum; Output various functional curves and can scale, translate, and compare the curves; Generate pie and column distribution maps of power quality; Automatically output power quality statistical reports, 95% probability values, and average values. This device can be equipped with a printer function according to customer needs, and other data and functions can also be added to the backend analysis software.
![]() National ordering hotline:fifteen billion eight hundred and three million one hundred and twenty-five thousand five hundred and sixty-five
National ordering hotline:fifteen billion eight hundred and three million one hundred and twenty-five thousand five hundred and sixty-five


